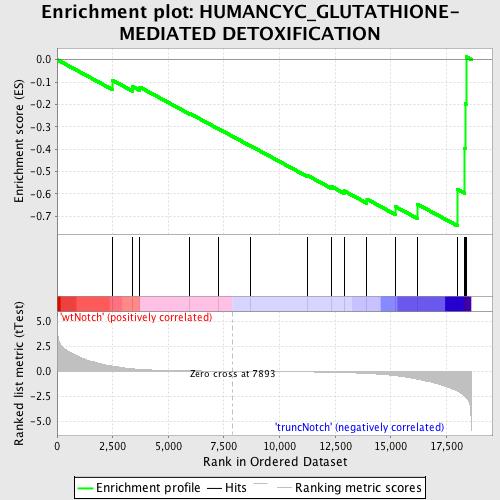
Profile of the Running ES Score & Positions of GeneSet Members on the Rank Ordered List
| Dataset | Set_03_truncNotch_versus_wtNotch.phenotype_truncNotch_versus_wtNotch.cls #wtNotch_versus_truncNotch.phenotype_truncNotch_versus_wtNotch.cls #wtNotch_versus_truncNotch_repos |
| Phenotype | phenotype_truncNotch_versus_wtNotch.cls#wtNotch_versus_truncNotch_repos |
| Upregulated in class | truncNotch |
| GeneSet | HUMANCYC_GLUTATHIONE-MEDIATED DETOXIFICATION |
| Enrichment Score (ES) | -0.7430259 |
| Normalized Enrichment Score (NES) | -1.5030366 |
| Nominal p-value | 0.03505843 |
| FDR q-value | 0.4737896 |
| FWER p-Value | 1.0 |
| PROBE | DESCRIPTION (from dataset) | GENE SYMBOL | GENE_TITLE | RANK IN GENE LIST | RANK METRIC SCORE | RUNNING ES | CORE ENRICHMENT | |
|---|---|---|---|---|---|---|---|---|
| 1 | GSTM1 | 1940332 6590463 | 2478 | 0.514 | -0.0915 | No | ||
| 2 | MGST3 | 3450338 5290736 | 3391 | 0.248 | -0.1204 | No | ||
| 3 | GSTP1 | 3170102 3710707 5080368 | 3716 | 0.186 | -0.1227 | No | ||
| 4 | GSTO1 | 6650600 | 5965 | 0.038 | -0.2405 | No | ||
| 5 | GSTM3 | 2570451 | 7249 | 0.010 | -0.3086 | No | ||
| 6 | GGH | 4850373 6290152 | 8679 | -0.013 | -0.3844 | No | ||
| 7 | GSTA2 | 2600047 6550139 | 11258 | -0.066 | -0.5177 | No | ||
| 8 | GSTA3 | 2470193 | 12344 | -0.106 | -0.5674 | No | ||
| 9 | GSTT1 | 5290520 | 12898 | -0.135 | -0.5862 | No | ||
| 10 | MGST1 | 6020605 | 13928 | -0.223 | -0.6234 | No | ||
| 11 | GSTM2 | 4730341 7650022 | 15211 | -0.437 | -0.6569 | Yes | ||
| 12 | MGST2 | 2650129 | 16183 | -0.788 | -0.6451 | Yes | ||
| 13 | GSTT2 | 1580519 | 18005 | -2.010 | -0.5800 | Yes | ||
| 14 | GSTA4 | 1660369 | 18321 | -2.453 | -0.3980 | Yes | ||
| 15 | GSTM4 | 2340181 | 18341 | -2.494 | -0.1968 | Yes | ||
| 16 | GSTZ1 | 7000451 | 18383 | -2.608 | 0.0125 | Yes |

